Why we love it
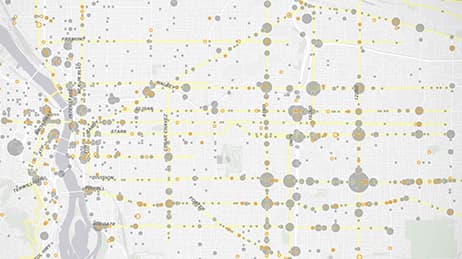
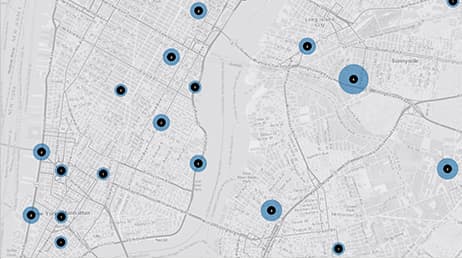
This map has it all! Built to support the Vision Zero Initiative in New York City, it shows real-time data including traffic accidents by type, live traffic cameras and conditions, air quality and weather. We love how this map creates a synoptic, 3D view of an urban landscape’s heartbeat and health. Summary statistics across the bottom synthesize what the animation is showing. This map provides citizens, planners and elected officials with the information they need to improve safety in the City That Never Sleeps.
Why it works
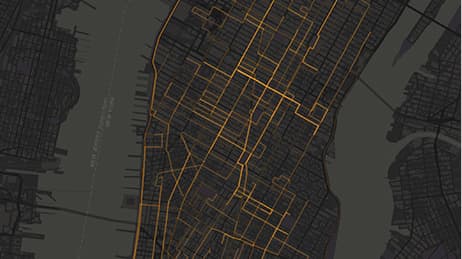
This map works because it shows current traffic conditions along major roads, including recently reported accidents, in New York City. Watch the entire traffic system, or click the cards along the bottom to drill-in and get ‘report cards’ on individual incidents. Click the incident for a 3D guided tour. Cartographers have long been tantalized by the dream of maps that are never out of date. The dream is now real thanks to the advent of sensor networks, wireless communications, GIS, and powerful APIs.
Important steps
Use coloors and animated symbols to show information
Determine conditions of the collisions
Cache the data every 30 minutes
Use external renderers
Requirements
Data and software
Analysis
Time
Tips and tricks
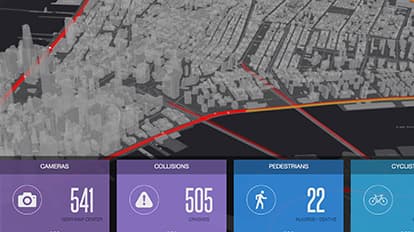
Show location of incidents with ‘report cards’
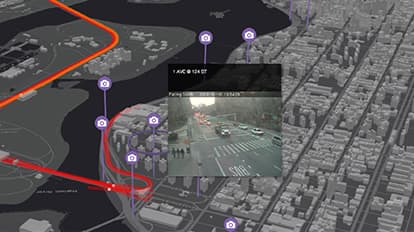
Show live coverage
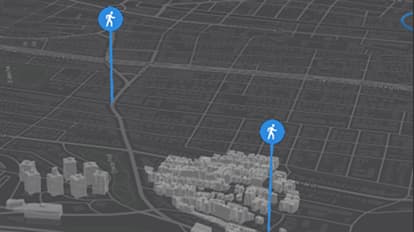
Animate your pushpins
Resources
Map Author
Sajit Thomas
UX Architecture, changing the world one app at a time.