Why we love it
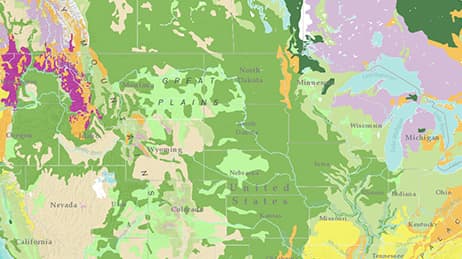
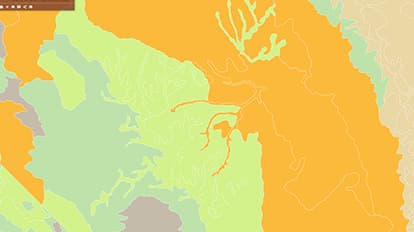
Most people probably don’t give much thought to soils, or know very much about the geography of soil types. But soil data is very important to those who work as engineers, hydrologists, farmers, foresters, and planners. We love how this map shows the power of transparent overlays. It brings that data into an organized landscape showing the way major soil types follow ridges, rivers, and valleys.
Why it works
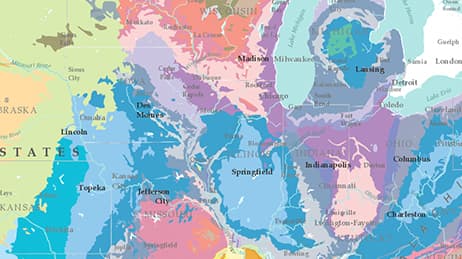
This map works because it’s interesting and beautiful. Beyond the great use of transparency and vibrant colors, it contains gorgeous labeling. Case and spacing is used very deliberately to both denote and differentiate features. The text curves to mimic the shape of geographic features, giving a level of professional polish rarely seen in online maps. Labels sit above the other content, making for better legibility. Text boxes provide even more detailed information.
Important steps
Place labels above content
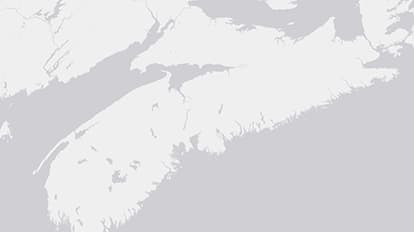
Your basemap may not need labels
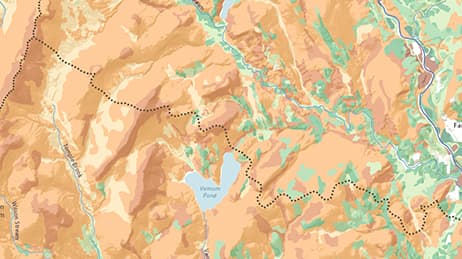
Use multidirectional hillshade relief
US Soil Data
Requirements
Data and software
Analysis
Time
Tips and tricks
Leave room for your labels
Start with bold vibrant colors
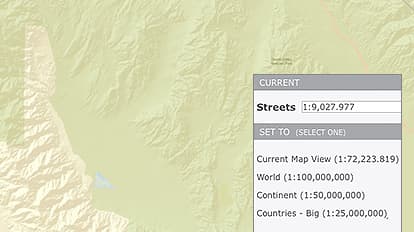
Choose a view
Resources
Map Author
Charlie Frye
Chief cartographer at Esri, geographer, information engineer, historical GIS (American Revolution) addict.