Why we love it
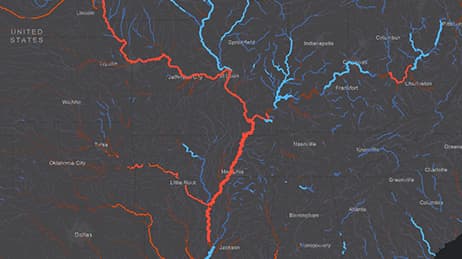
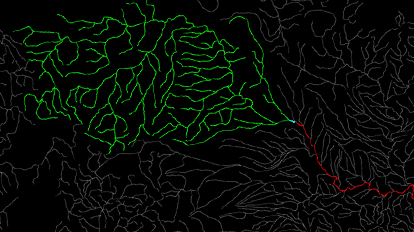
This map application is deceptively simple upon first glance, but rewards your curiosity with every mouse click. As you explore each river you find rich details and stunning patterns. Move your cursor over a river to see its network and a month-by-month chart of water flow for 2014. We also love this feature: Put your cursor at the centre of the radial chart, and slowly pull downward to navigate a river from where it meets the ocean or international border.
Why it works
On this map, every pixel is data. It does not have unnecessary ornamentation, not even the traditional basemap, borders and text labels. Now the data and its patterns take centtr stage. This interactive map shows us how river flow changes throughout the year, and how the timing of maximum flow changes based on geographic region. This same technique could be used to map rail, logistics, shipping or telecommunications.
Important steps
Create network from data
Ensure clarity for use
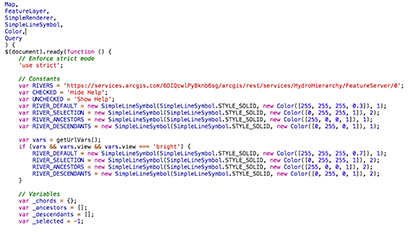
Configure the source code
Requirements
Data and software
Analysis
Time
Tips and tricks
Pre-process the information for fast performance
Show the flow
Resources
Map Author
Richie Carmichael
A 13-year veteran at Esri and the Applications Prototype Lab. Trained as a New Zealand land surveyor. Striving for world peace one map at a time.