Why we love it
During the last ice age, powerful floods shaped the rugged terrain in the eastern part of the US state of Washington. This award-winning Cascade Story Map tells the story of those floods and the landscape they left behind. We love the rich combination of static and animated maps, 2D and 3D graphics, photographs, and satellite imagery. The animated GIFs in the side panels explain key concepts, and well-labelled flood maps reveal the sequence of events. By artfully blending different aspects of the story across maps, graphics, and text, this story map creates an engaging self-paced experience.
Why it works
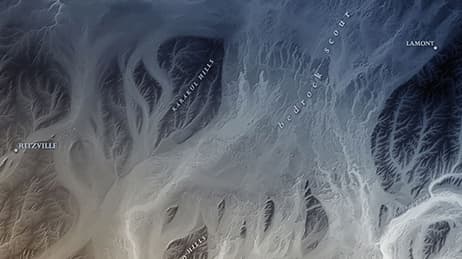
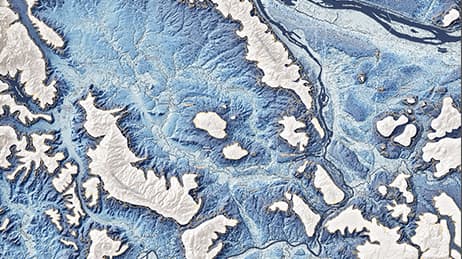
Annotation and sequenced overlays for maps and photos serve to educate us quickly as we explore the geological evidence. We see how scientists were able to make sense of eastern Washington’s bizarre, unique landscape. This map works because of its skillful use of timing and storytelling. In particular, the low sun-angle Lidar map and false color hillshading blend into the story as we scroll. This technique brings geologic features into sharp relief. We see things as the geologists do, and get a sense of scale for the ice age flooding and aftermath.
Important steps
Make small, logical sections of information
Collaborate for historical data
Create detailed 3D map surface features
Keep labels and annotations consistent
Requirements
Data & Software
Analysis
Time
Tips and tricks
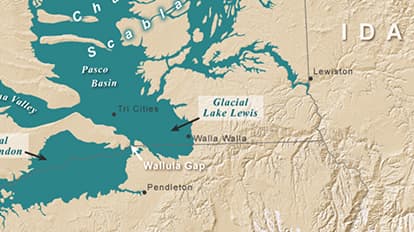
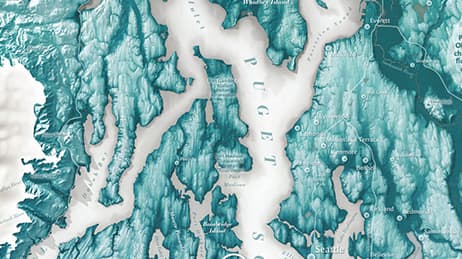
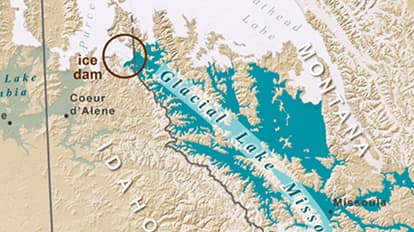
Orient the reader with modern landmarks
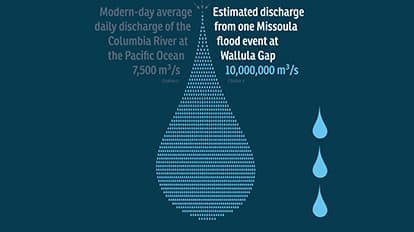
Communicate some facts as charts and graphics
Use GIFS on your map
Resources
Map Author
Washington Geological Survey
The Washington State Department of Natural Resources provides innovative leadership and expertise ensuring environmental protection, public safety, funding for schools and communities, and a rich quality of life.