Web and Mobile Apps
Site selection, business analytics, and demographics in the cloud
See people and opportunities clearly, and reach your target customers by using ArcGIS Business Analyst in a web browser or on your iOS or Android device. Optimise site selection to identify the most profitable sites, employ easy-to-use business analytics tools, access authoritative demographics, create beautiful maps and professional reports, and instantly share your market research with decision-makers —no matter where you are.
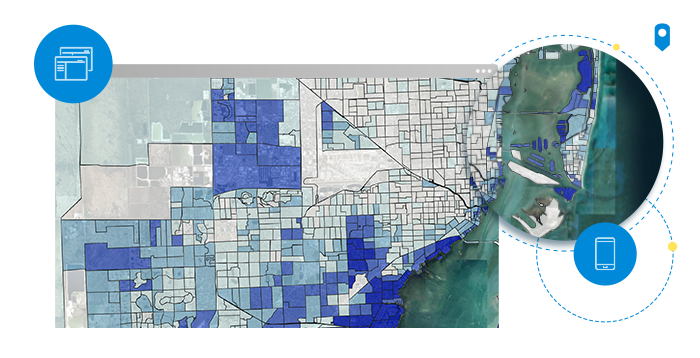
Understand your customers
Identify an area of interest, select a workflow, and see opportunities clearly. Industry leaders use Business Analyst for site selection, to highlight data of concern, visualise what's missing, and to create compelling infographics to share with their teams. Leading retailers, hospitals, and consulting firms alike all use Business Analyst to better understand their customers.
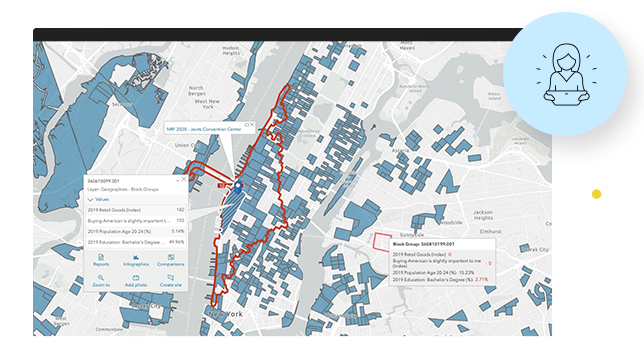
Optimise and grow your business
Your location-based decisions can cost you millions if they aren't absolutely perfect. Make informed decisions and reduce losses with Esri's proven spatial and business analytics to help you understand gaps in target markets, identify the right customers, and select the ideal product mix using behavioral insights and data.
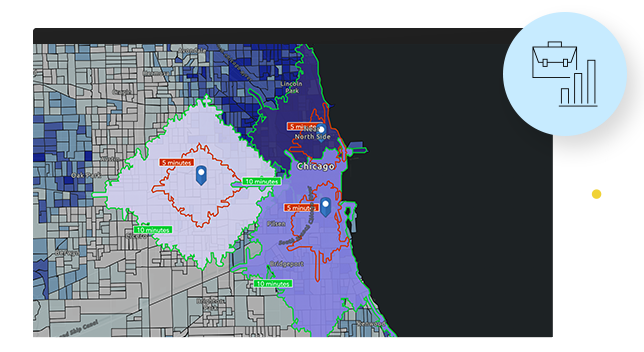
Access global data and demographics
Your data and our data—analysed side by side. Work with public data and consumer spending, market potential, traffic, crime, health care, and lifestyle datasets curated by Esri demographers. With 15,000+ geodemographic variables for over 90 percent of the world's population, you can analyse your client's needs locally and globally.
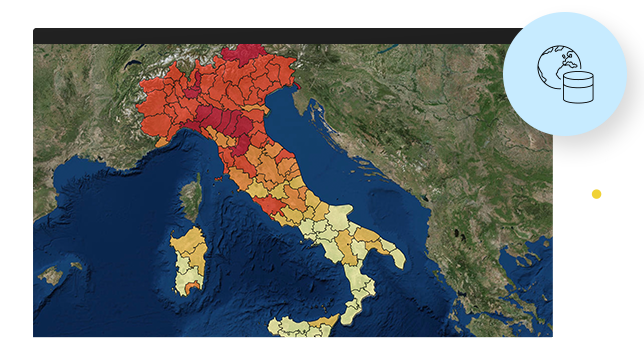
Share your work and present your findings
Your presented work has never looked so good. Business Analyst has done the hard work for you by putting data in preformatted yet fully customisable infographics and reports. Your work can be shared privately in your organisation or publicly with your stakeholders as compelling infographics, story maps, or even as embeddable web apps.
Helpful resources
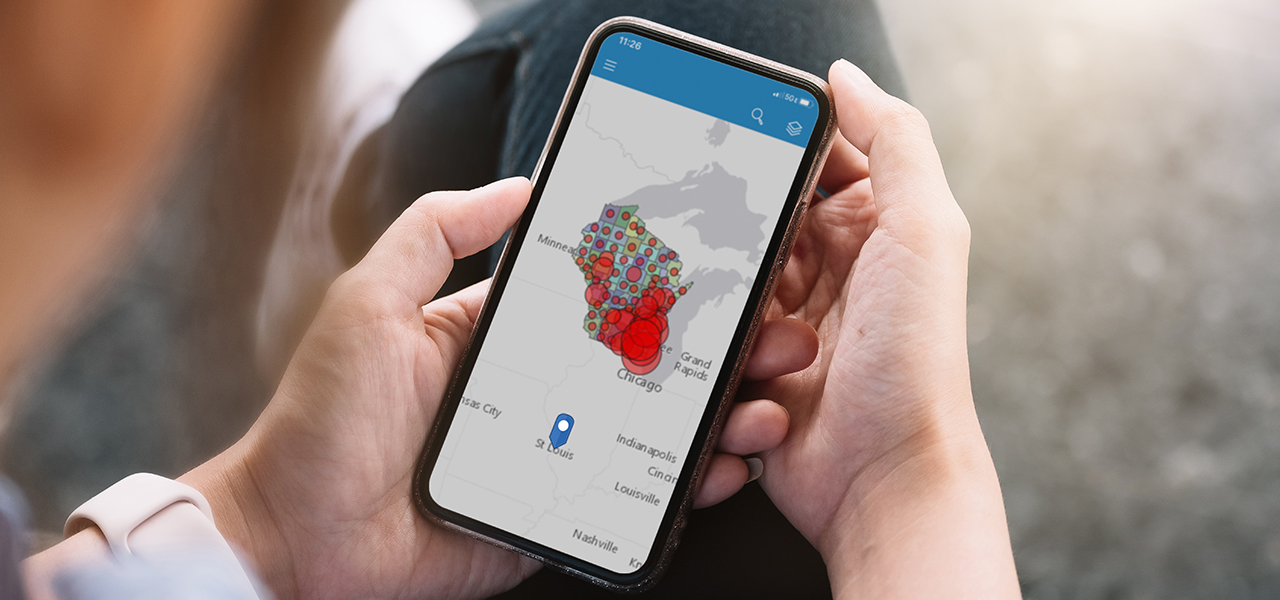
Analysis on the go
Visiting a site, meeting a client, or working remotely? You can run the Business Analyst Web App on a tablet or use the native mobile app on your smartphone for the location intelligence you need to close a deal.
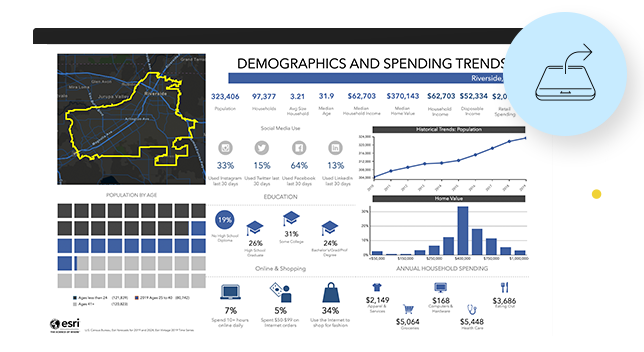
Explore and interact with Business Analyst infographics
With ArcGIS Business Analyst Web App, you can visualize key indicators and information in the form of beautiful infographics—and we’ve made it simple to try. Simply select the infographic report you’re interested in and work with it the same as you would after exporting from Business Analyst.

Download ArcGIS Business Analyst Mobile for iOS and Android


Other Ways to Contact Us
Office Locations